Portfolio Analysis with Synthetic Intervals: Beta Release
Portfolio triage tool for identifying sites with high solar and storage savings potential
What is Portfolio Analysis?
Arcadia’s Portfolio Analysis tool uses the Synthetics Intervals service to estimate 15-minute usage curves based on a site’s building characteristics. The service is designed to support use cases where real interval data is either unavailable or inaccessible:
- Greenfield project development where there is no account history to draw from
- Sites serviced by utilities that don’t publish interval data
- Challenges with accessing the utility account credentials (ex. rental agreements)
- Applications for which real interval data is too costly
In such instances, Synthetic Intervals provide estimated “proxy” curves for the target site, thereby unblocking a data dependency for a variety of applications.
What Use Cases Does the Beta Release Support?
There are many use cases for Synthetic Intervals: budget planning, internal tracking of costs/savings against a theoretical baseline, ESG reporting, bill management, etc. The initial launch of the service, however, is focused on portfolio analysis for Distributed Energy Resources (DER) for Commercial and Industrial (C&I) sites. This means we’ve tailored the outputs from the API and UI to serve up information that’s pertinent to commercial solar and storage prospecting and project development. Specifically, calculated values like a solar compatibility score, load factor, peak demand magnitude, and hour of daily peak demand. Put another way, the beta release acts as a triage tool that helps users quickly evaluate a list of sites to determine the ones with high savings potential from installing solar and storage.
The table below details the features included in the beta release and those that are scheduled for future development - target dates subject to change.
| Beta (7/1/24) | GA (11/1/24) | Roadmap | |
|---|---|---|---|
| Accessible via the Arc API | YES | ||
| Usage profile source: NREL Comstock | YES | ||
| Usage profile source: Arcadia database | NO | NO | YES |
| Support for residential sites | NO | NO | YES |
| 3rd party building data to augment user input | YES | ||
| UI available in Arc Dashboard | YES | YES | |
| Persistence of results in Arc Dashboard | NO | YES | |
| Switch/Signal Integration | NO | NO | YES |
| Plug integration | NO | NO | YES |
What Does a 'Beta' Release Phase Mean?
The intent of the beta release phase is to collaborate with select customers on our newest product capabilities and solicit feedback as our product progresses towards its final form. Beta features and APIs are subject to change and we may introduce ad-hoc breaking changes if necessary. Support for beta functionality typically rests with the product development team rather than our dedicated support team.
How it Works
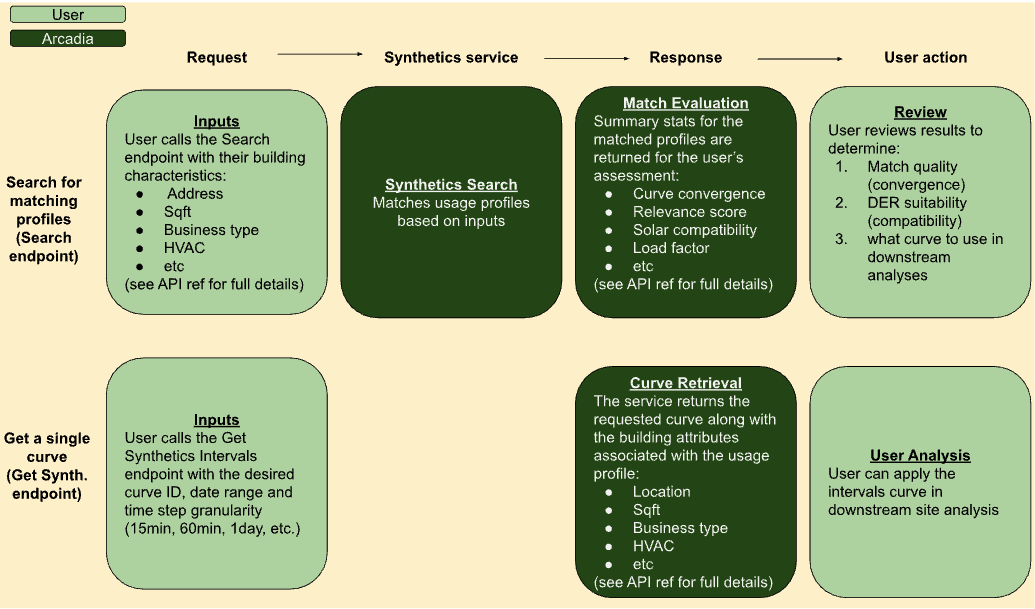
The beta release of Portfolio Analysis with Synthetic Intervals is designed as a two step workflow.
- Step I: Initially, the service takes in building information from the user and searches our database for profiles that match the characteristics of the given site. The set of matched profiles is then analyzed for variance across a number of different dimensions that determine whether the building is a good candidate for Behind the Meter (BTM) solar and storage installations. Importantly, this first step does not return a specific usage curve. Rather, it provides a statistical summary of all potential usage curves, allowing the user to assess match quality (curve convergence), DER suitability (compatibility scores), and to select a specific profile to use in downstream analyses.
- Step II: the user then has the option of retrieving the usage curve associated with their selected profile.
For additional information and more technical documentation of these two endpoints please see the API Reference for Synthetic Intervals.
How to Evaluate Matched Curves (Reviewing the Step I Response):
There are two types of calculated metrics returned by the Search endpoint: a convergence score and a collection of compatibility scores. Each is designed to help guide users through the portfolio triage process. Detailed below are descriptions of these scores along with an explanation of how they are meant to be interpreted.
Convergence score: A composite score representing how tightly clustered the curve shapes of the matched profiles are [0-1].
- A site with a high convergence score indicates to the analyst that the set of possible proxies generally follow the same usage patterns and share a common load shape. This makes choosing a specific curve easier as the differences between the matched profiles will not lead to meaningfully different results in downstream analyses.
- Alternatively, a site with a low convergence score means the service matched the site to a wide variety of profiles, each with significantly different load shapes. In this case, it is much harder to ascertain which of the curves to use. Sites with poor convergence are generally a result of low information queries and can be improved by repeating the request with more complete inputs. In some cases, however, low convergence reflects a lack of similar sites in our database - examples include rare building types (large office in a rural county) or incompatible inputs (a 100 square foot hospital, or a site with 1,000 kW of annual demand but only 100 kW of usage).
Compatibility Score: A collection of calculated values aimed at quantifying the suitability of the site for BTM solar and storage.
- Solar score: % of usage in daylight hours. The higher the value, the more a site can benefit from solar.
- Load factor: Defined as consumption (kWh) divided by demand peak (kW), averaged over billing periods. Load factor is a common industry standard for evaluating how smooth (vs. “peaky”) a curve is. Higher scores indicate smooth consumption, while low scores indicate more spiky behavior. In general, a low load factor is associated with sites that could benefit from storage.
- Peak Magnitude: Defined as daily demand peak (kW) divided by average daily consumption, averaged days in the year. Higher magnitude typically translates into higher demand charges on the utility bill and represents an opportunity to offset costs with DERs - solar, storage, or both.
- Daily peak hour: Most common daily demand peak (annual mode). Whether peaks happen during daylight hours or after the sun sets can help guide analysts toward the importance of storage in managing electricity costs. Annual demand: Maximum power peak (kW) within the year. Higher annual demand peaks generally represent larger DER savings opportunities.
- Annual usage: Total kWh used within the year. Higher consumption generally represents larger DER savings opportunities.
At a high level, sites may fall into one of three categories:
- High convergence score and high compatibility score - indicative of a building that’s likely to benefit from BTM solar and or storage.
- High convergence score and low compatibility score - indicative of a building that’s not likely to benefit from BTM solar and storage.
- Low convergence score - indicative of a site that lacks enough information to determine whether it would benefit from BTM solar and or storage, or indicative of a site whose usage patterns differ significantly from those in our database.
Sites that fall into categories 1 and 2 can quickly be advanced into the next phase of project development or deprioritized, respectively. However, sites with low confidence scores that belong in category 3 will require additional attention from the analyst. The extent to which they are worth exploring further will depend on the user and the use case. The next section outlines how to navigate low confidence scores and why they occur in the first place.
The Challenge with Low Information Queries
The Synthetic Intervals service takes in as little or as much site information as the user has and returns an estimate of that site’s consumption curve. This means the service is designed to produce results, even for early prospecting when the only known data is a building address. Unavoidably, however, working with sparse information creates uncertainty. An address alone could generate several disparate matches; An office building or a hospital; A small 5,000 sqft structure or a large 150,000 sqft multiplex. These unknown factors introduce risk to both our results and the subsequent project analyses built on top of them.
Uncertainty can partially be mitigated by augmenting the base information available to the user with 3rd party building data integrations (targeted for release as part of the Synthetics beta in July 2024). As we gain insight into the site characteristics we can eliminate more profiles and narrow down the set of potential matches. Unfortunately, even with external sources there will almost certainly remain information gaps. Perhaps the most notable of these is the installed HVAC system; Typically unknown to the user and often absent from 3rd party databases. Thus, more inputs are likely to, but not guaranteed, to improve results.
When convergence scores remain low despite sending the service more information, we strive to reframe the question at hand. Instead of focusing on whether the site is a good candidate for BTM solar and storage, we encourage the analyst to shift their thinking towards understanding what the site should look like in order to be a good candidate for BTM solar and storage - a subtle but important distinction. The following section provides further details on this approach.
Navigating Low Convergence Scores
As previously mentioned, in the context of DER prospecting, the purpose of Synthetic Intervals is to help users identify the solar and storage potential of each site. The more information we have, the closer we can get to a tight cluster that indicates a high-confidence match. In these ‘happy path’ scenarios, where we see convergence among the matched profiles, the Portfolio Analysis tool is effectively conveying confidence over our ability to estimate usage patterns, and by extension, DER potential.
However, in the absence of data we can still guide the user towards understanding what factors impact potential savings and to what degree. In these more complex cases, where we don’t see convergence, and therefore can’t confidently estimate usage patterns, we focus our efforts on discerning what drives the different curve shapes.
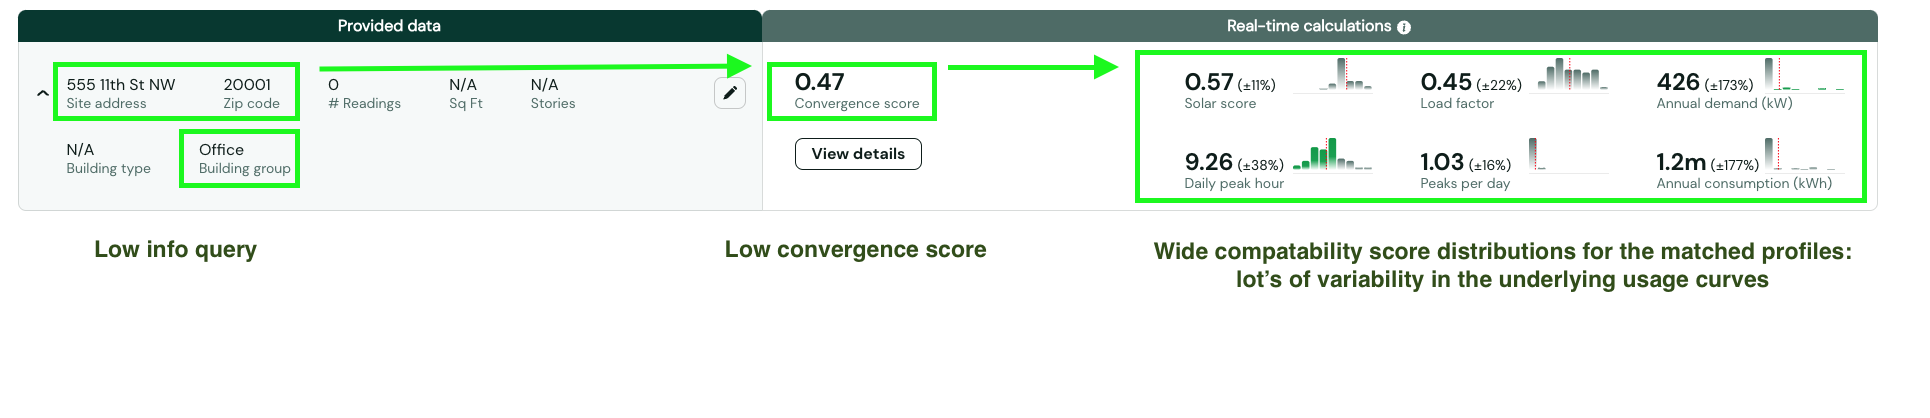
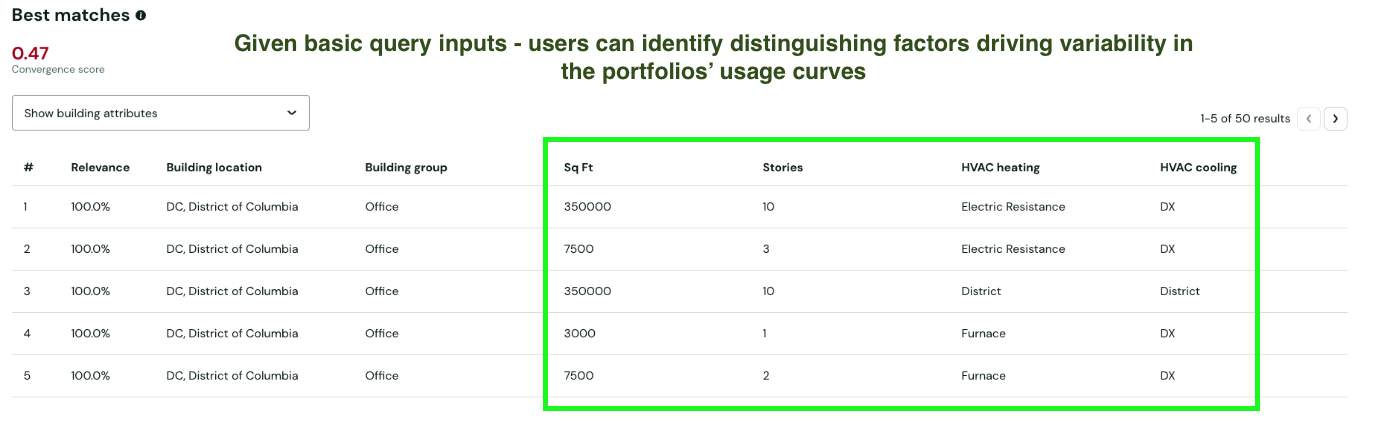
To make this more concrete, consider a collection of curves returned from a search against an office building in downtown DC. The lack of specificity in the query coupled with the a large number of DC office building profiles in our database results in a convergence score of 0.47. As you can see in the screenshot below, our top matches reflect a range of curves with wide distributions across relevant DER metrics.
In the absence of additional information the user must then take a closer look at what factors are influencing the results. Clicking into the site view, they can immediately identify two potential culprits: building size (given by Sqft and Stories) and HVAC type.
How the analyst decides to proceed will depend on each company’s internal policies and business model. In some cases, this insight may justify having an analyst chase down the missing information to get a more accurate result. In others, they may simply assume a conservative approach and use the curve with the lowest savings estimate. Either way, our hope is to surface useful information that can unblock early triage of DER project development.
To summarize, the key to extracting useful insights from the Synthetics service is determining which of the following two answers you can get given the inputs and resulting uncertainty:
- This is what the site probably looks like (high information, high convergence)
- This is what the site needs to look like in order to be a good fit (low information, low convergence)
Data Sources
The beta release relies on the NREL ComStock collection, publicly available building profiles that include year-long consumption curves and are broadly accepted for benchmarking electricity usage within the industry.
To use the Portfolio Analysis with Synthetic Intervals service, users need to provide at least a postal code for each site. Additional information will enhance the resolution of the analysis. Arcadia partners with a third-party building data provider to optimize site matching. If an address is provided, we may supplement your analysis with additional details such as square footage, number of units, number of floors, and building type (office, warehouse, retail, etc.), thereby improving the accuracy of our results.
In future releases, the Synthetics service will be augmented with additional sources:
- Arcadia’s proprietary intervals database - Augmenting the simulated NREL profiles with real-world intervals creates a singularly comprehensive database to power the service.
- Plug data - pulling in account-level data from Plug to better estimate the characteristics of the site.
Supported Building Types
| Building Type | Detail |
|---|---|
Full-service restaurant |
Bar, restaurant |
Quick service restaurant |
Fast food |
Hospital |
Hospital |
Outpatient clinic |
Outpatient clinic |
Large hotel |
Hotel, casino |
Small hotel |
Motel |
Large Office |
Office buildings, banks - size based on ASHRAE thresholds (~500k sqft) |
Medium Office |
Office buildings, banks - size based on ASHRAE thresholds (~50k sqft) |
Small Office |
Office buildings, banks - size based on ASHRAE thresholds (~5k sqft) |
Retail - Standalone |
Department store, freestanding, garden center |
Retail - Strip mall |
Showroom, storefront, storefront office/retail, storefront office/residential, post office |
Warehouse |
Distribution center, light manufacturing, service, truck terminal, non-refrigerated warehouse, airline hanger, self-storage |
Primary school |
Primary school |
Secondary school |
Secondary school |
Updated 5 months ago